
For any organization developing Power BI reports, there is a strong desire to design them in a way that provides the best end-user experience. It includes not only providing excellent data visualization in reporting but also creating Reports and Dashboards for optimal performance. Optimization in the Power BI models means looking to deliver the best possible experience to users.
This Blogpost gives the ideas to developers and administrators to develop and maintain their optimized solutions for Power BI. You can do Power BI optimization at different structural layers, which includes:
- Data Model
- External models (live connections):
Azure Analysis Services
SQL Server Analysis Services (via a gateway to on-premise)
- Internal models (Dataset modes hosted in Power BI service):
Import model
DirectQuery model
Composite model (in preview)
- Visualization rendering (Power Bi Reports and Dashboards)
- Data Refresh
- The Power BI environment, including capacities, data gateways, Report Server, Power BI Services, and the network
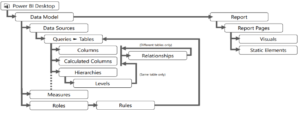
Data Model optimization: –
The data model supports the entire visualization experience. Data models external-hosted, internal-hosted, and in Power BI, they are referred to as datasets. It’s essential to understand your options and to choose the appropriate dataset type for your solution.
Below are the points that need to consider for power BI dataset
- Always try to avoid loading unnecessary data into the model
- Use necessary columns and column types in data mode
- Use Vertipaq Analyzer to see report dataset object storage, to know where data reduction is required
- Disable Auto-date time functionality for models, because it creates column hierarchy and that increases unnecessary data size.
- Use composite data models (Mix mode) and disable power query load
- Prefer to costume columns and measure instead of getting from the source
Data reduction can boost the performance well because keeping only relevant data in the model reduces disk space and memory utilization.
Visualizations loading and optimization performance: –
Visualizations can be Power BI reports, dashboards. Each has different architectures and their administration. Power BI is a popular tool to create dashboards and reports from your data.
Dashboard: –
The drag and drop interface makes it quick and easy to build a simple dashboard from scratch. However, once things get more complicated when you keep adding widgets, your dashboard’s speed might get reduced.
It’s essential to understand that Power BI maintains a cache for your dashboard tiles except for living report tiles and streaming tiles.
- Pin reports which are highly requested by business
- Use default power bi reports in the dashboard.
- Visuals with a direct query and live connection must be optimized
Report: –
Power BI Desktop has many visualizations to represent data in its best form to make an insightful report for business. But visualization must represent the data in its optimal way, so visual rendering time must be optimal.
- Use reports which are part of default visuals
- Limit number of the report on the page
- Restrict data in visuals with appropriate filters, because more the data slower the visuals
- Optimize the custom visual performance with the Performance Analyzer
Power BI Environment optimization: –
Power BI report and dashboards are hosted in power bi Services and Power BI report server(on-premises) where business users can access the developed reports and dashboards. So optimization of the environment also plays an important role.
- Power BI Capacity: Power BI service online uses cloud resources to compute Dax and Visualizations. The resource provided by Microsoft depends and the license taken. If the current license does not full the requirement then consider upgrading the license and that will upgrade resource capacity
- Data Refresh: Data refresh in power bi services depends on the source database and resource of the server. If Data refresh is the time taken, then optimization is required on source query or data model in power.
- All source query should be performed better
- Fetch only required columns in the model
- Use appropriate data type in the model
- Use auto Datetime hierarchy if only required or best practice is to use a date table in the model.
- Data Gateway: Power BI service uses data gateway when data is not available online and resides on-premises. Data gateway resources must be set as the load and less frequent dataset refresh should be scheduled to data refresh.
Also below point to be considered:
- Number of concurrent data refresh should be less
- Number of Concurrent users for live connections should be considered
- Ensure low network latency is there, also use Azure speed test to find out any issue with latency
- Use Azure Express route for secure connection
- Use optimized modelling and incremental data refresh, so less data needs to be transferred over the network
- Limit Auto page refresh and use composite data model for small datasets
What Next?
It is always better to make a habit of creating performance proficient reports and visualization for business, which can be refreshed and interact with low latency. Above mentioned tips can help us to develop an optimal reporting solution.
There are tools provided from the Microsoft side to optimize and analyze the issue with report rendering and dataset refresh. Azure test Speed for analyzing network latency, Performance Analyzer to examine report rendering in Power BI desktop, DAX studio to debug Dax related issues and Vertipaq Analyzer to see report dataset storage in the model.
Reference:
- https://docs.microsoft.com/en-us/power-bi/guidance/power-bi-optimizatio
- https://docs.microsoft.com/en-us/power-bi/guidance/import-modeling-data-reduction
- https://docs.microsoft.com/en-us/power-bi/guidance/gateway-onprem-sizing
- https://docs.microsoft.com/en-us/power-bi/create-reports/desktop-performance-analyzer
- https://www.sqlbi.com/articles/data-model-size-with-vertipaq-analyzer/


