
Every Reporting tool provides us a better-visualized approach to represent our data and analysis of that data. One main feature of these tools that makes them more beneficial is their offline Reporting Capabilities.
Offline Capabilities in general mean the feature to access the reports, dashboards, or the data even when not connected to the Internet. The functionality where we can share the data of the report or the report itself to users and it can be accessed later even when there is no internet connectivity.
In this blog, I will Explain the multiple offline capabilities provided by Microsoft Power BI.
Power BI Offline:
• Power BI Mobile App
• Power BI Subscription
• Power BI Export
• Analyze in Excel.
• Paginated Reports
• Rest API functionalities in Power BI
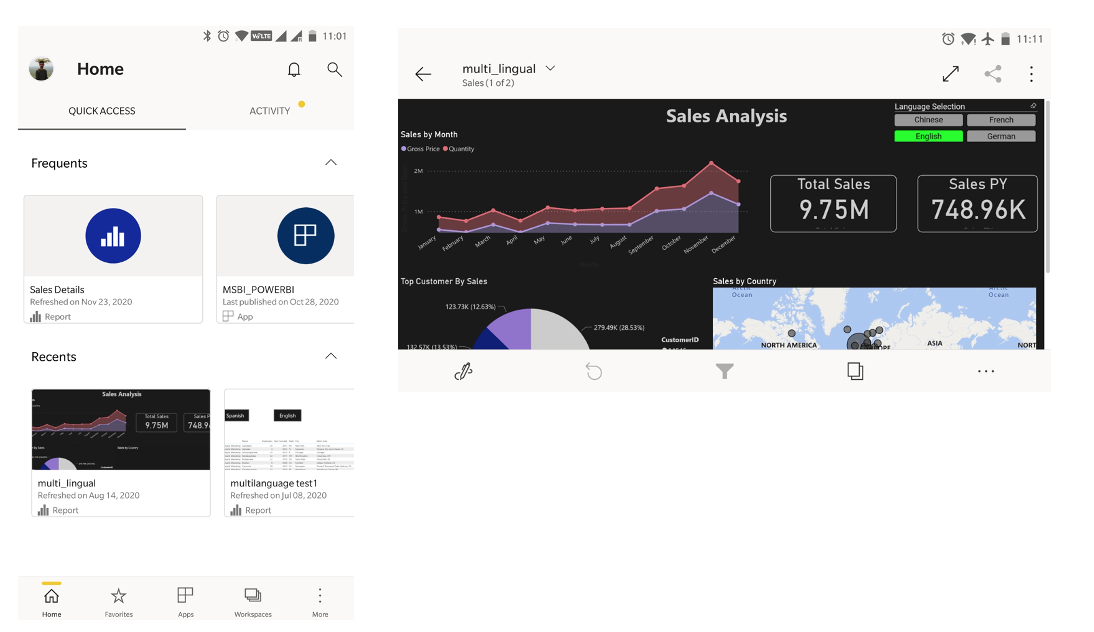
Power BI Mobile
• The PowerBI reports can be accessed through Mobile PowerBI App available in Android and iOS.
• The Mobile app provides the ability to access the reports and dashboards of PowerBI on the Internet as the Reports are stored in a cloud-based environment. This does not need a VPN connection on the mobile.
• With the frequent dataset Refresh functionality of PowerBI, users can get updated data in the mobile.
• When in offline mode, users can open the dashboards they've accessed when connected to a network.
• The Cache of the dashboard is stored in the Device so that it can be opened when not connected to the internet.
Prerequisite
• Microsoft Power BI Account and App installed in the Mobile phone.
• In this approach, the user has to open the dashboards once on their devices when online, in order to access it in offline mode later.
Pros
· Users can access all the dashboards and reports on their mobile devices on the go.
· If connected to a network user can interact with the dashboard, apply/change filters, apply analysis questions on the dashboard.
· Even when not connected to the internet users will be able to open previously accessed dashboards and reports.
Cons
· Only 250 MB of data can be cached offline.
· Maps and some of the tiles which require an active backend server are not supported.
· Users cannot access Paginated reports in the mobile app in offline mode.
· In offline mode, users haveRead-only access.
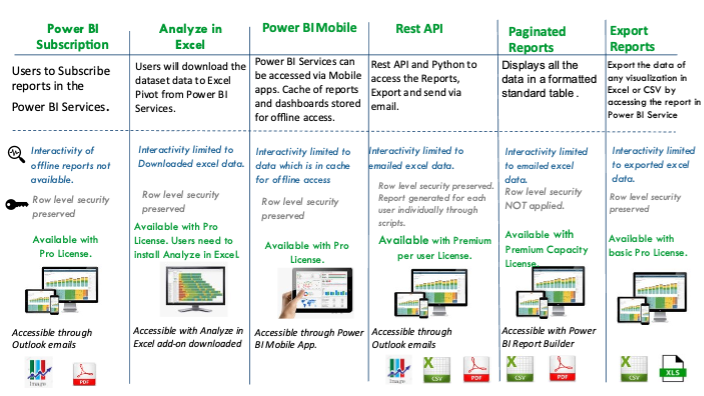
Power BI Subscription
Users can subscribe to report pages and dashboards in the Power BI services portal, and Power BI will email an image of the dashboard/report and a link to access the report in the mail
• Users can set the scheduled time, frequency, users on the portal for the report subscription.
• The snapshot of the dashboard or report of the pages selected in the subscription will be sent.
• The link will open the report in Power BI services.
Steps to Subscribe to a report
Open the required report in Power BI services and navigate to Subscribe icon.
• On clicking the subscribe button you will get a subscription window.Click on the add new subscription option.
Pros
• This is the easiest way of receiving the visualizations in the email as the scheduled delivery is set up.
• The reports received will also be viewable through IPAD and Android devices as it is an image file.
Cons
• Users will get an image of the report in the mail along with the report link. There is no Excel format of the report.
• There is no interactivity in the report's output as it's an image output.
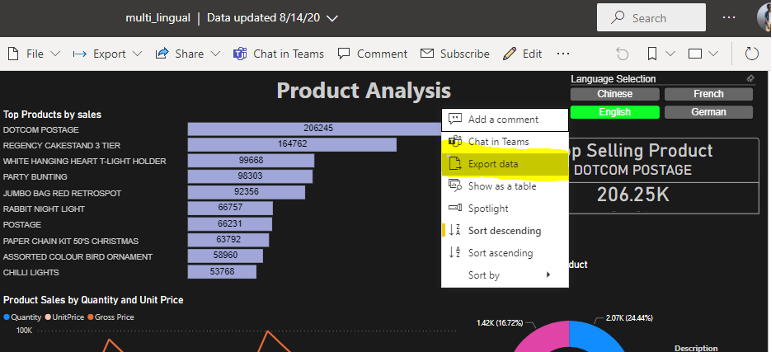
Power BI Export Reports
• With this option, Users can Export the data of the visualizations Xlsx or CSV files.
• In the Power BI Service portal, to Export the data user will have to click on the menu button of the visualization/chart or the Export button for the report and select the Export data option.
• Since the reports published in the services have aggregate visualizations, users can export the data in two ways:
i. Summarized data
ii. Underlying data – detail level data.
• The Exported data adheres to RLS defined.
Prerequisite
• Microsoft Power BI Account & Power BI Pro or Premium License.
• Users must have the edit permissions to the underlying data source and report.
Pros
• The user will be able to download the excel data with a simple process.
• The data can be exported as required by the user and will not be continuously delivered as in subscription mode wherein it may be delivered on schedule.
Cons
• The limit for CSV files is 30000 rows max and for Xlsx file is150,000 Rows.
• User needs to be connected to Internet when exporting the data. VPN is not required.
• The export can work only using the Desktop or using Microsoft surface.
Analyze in Excel
• Using this feature users can use Power BI data Models in excel.
• Users can view and interact with the models using Pivot Tables, charts, slicers, and other Excel features.
• The Excel file contains MSOLAP connection string (.odc file) that connects to the Power BI dataset. When a user works on the data, Excel queries the dataset in Power BI and returns the required results in an Excel file.
Prerequisite
• Users must have Power BI Pro or Premium License.
• Every User should have the “Analyze in Excel” add-on downloaded and installed in their machine.
• The Report stores the pivot model in the excel file.
Steps to get data for Analyze in Excel:
• First go to the required report or dataset in the Power BI Services and click on the menu.
• Select the Analyze in Excel option, as shown in the image below.

• The excel model can be saved and used offline and shared in the mail.
• The downloaded Analyze model is updated automatically every time the data set is updated and republished in the Power BI Service.
• Users can schedule the refresh of the model in excel and the model will get updated accordingly with the schedule.
• Analyze in Excel is much more beneficial for datasets and reports that have the following data sources:
i. Analysis Services,Tabular or Multidimensional databases
ii. .PBIX files or Excel workbooks where measures are created using Data Analysis Expressions (DAX).
• Users can easily Save and share(via email) the Excel workbook created using the Power BI Model.
Pros
• Users can save the Excel workbook created with the PowerBI dataset, just like any other workbook, and share via Email and there is NoMaximum number of exported row limitations.
• The pivot excel model can be scheduled to refresh, and data gets updated in an excel file whenever the data source is updated in Power BIService Portal.
• This approach makes it easier for the user to export tabular data of the reports and dashboard to use even when they are not connected.
• Interactive data analysis is possible for the format of the pivot table last downloaded.
• Offline access of the data in excel is available.
Cons
• Analyze in Excel is only supported on Microsoft Windows andMicrosoft Devices It cannot be used in IPAD’s.
• Guest users cannot access the Analyze in Excel models when sent to another user.
• This involves the processing of the data for every selection and hence cannot be recommended as an enterprise-level distribution solution.
Paginated Reports
They're called paginated because they're formatted to fit well on a page. Being tabular, paginated reports fit perfectly on a page and display all the data of the table spanning across multiple pages.
• By using paginated reports users can print all the tabular data of a report in multiple pages
• Users can subscribe to paginated reports in multiple format attachments such as PDF, PPTX, XLSX, DOC, CSV, XML.
• Paginated reports are created using a new stand-alone tool fromMicrosoft Power BI – Report Builder.
• Paginated reports are designed to be printed or shared.
• Paginated reports can export or print all the data present in the report, if the report has a scrollbar, paginated report will print all the data over multiple pages.
• In Paginated reports, users can easily use and implement filters, sorts, groups, formulas &custom expressions.
• Users can customize the reports in multiple ways by adding charts, indicators, and visuals. They can add parameters and filters to refine the data better and even embed images and external content.
• These reports can be subscribed to other users and also used for distribution of the reports in excel format which is one of the requirements for the enterprise level of distribution.
Prerequisite
• Power BI Premium License / Premium Capacity.
• The Microsoft Power BI – Report Builder tool needs to be installed to create the paginated reports.
Pros
• The neatly formatted reports can be used for Enterprise reporting to send pixel-perfect reports to users.
• The reports can be sent to wide number of users through email.
• The reports can be delivered in Excel format and can be used offline for analysis.
• Can be accessed through a desktop. For mobile devices, the excel sent through email can be opened through other apps. The excel reports are accessible on IPAD and Android devices.
Cons
• Maps, interactive features and power BI visuals are not supported.
• Paginated reports do not support sub reports are drill reports as well as Shared data sources and datasets.
• When sending emails to other users the RLS security would not apply based on the recipients but will be based on the senders' access permissions.
• This requires the workspace to be defined as of the premium capacity.
REST API
• Using Power BI REST API, users can perform operations that help in integrating with Power BI reports and dashboards.
• Few of the PowerBI REST API Operations.
i. Embedding of PowerBI reports& dashboards registered accounts and Non-Power BI accounts.
ii. Perform management for Power BI reports and data sets.
iii. Authenticate to Power BI, Access, update, refresh data sets.
• Complete list Operations that can be done on Reports using Rest API can be found on the below article.
• https://docs.microsoft.com/en-us/rest/api/power-bi/reports
Prerequisite
• Users must have Power Premium License.
• Power BI App must be registered on the AZURE AD apps.
Steps to Set REST API forPower BI.
• For the first step, we need to register the application on the Azure portal.
• To Register use https://dev.powerbi.com/apps. Here we can register the app with the permissions we want to grant to the Application.
• Reference: https://docs.microsoft.com/en-us/power-bi/developer/embedded/register-app?tabs=customers%2CAzure#register-an-azure-ad-app
• Once registered we can see the application details in the Azure AD page under the registered apps.

• Once the app is registered, we have the client id and client Secret(secret in case of app registered on the server.).
• Working with power Bi REST API requires two steps.
i. Generating an access token from Azure AD using the client id, username, and password obtained by registering the app to Azure AD.
ii. Calling the required API using the access token .
• Now We will use a Python code to call the Rest API and get an access token.
Code:
import requests
url ='https://login.microsoftonline.com/common/oauth2/token'
data= { 'grant_type': 'password', 'scope':'https://api.powerbi.com',
'resource':'https://analysis.windows.net/powerbi/api',
'client_id': '<Your ClientID>', 'username':‘varun.verma@smarterp.com’ 'password': <Pass> }
r = requests.post(url, data=data)
access_token= r.json().get('access_token')This code gives us the access token which later can be used to call the API to access the reports, datasets, or any Operations.
Pros
• The reports will be delivered to the users through email.
• The report will be filtered for the data which needs to be seen by the user.
• The reports can be delivered in .csv and excel formats.
• The data will be available for interactive analysis in excel files.
Cons
• The backend process needs to be monitored on regular basis to ensure the automated process is delivering the right data. The data is filtered foreach user and the report is delivered for the respective user.
• This is available only for Premium capacity nodes licenses.
By leveraging these features we can make a complete and fully utilized Power BI solution with best reporting features of the tool as well as a perfect sharing and accessible data and analysis approach.


